 |
| 2020 |
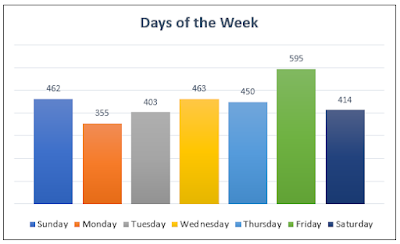
In late October, I caught up with logging 2021's bicycle mileage into the spreadsheet and noted some interesting trends compared with the previous year.
Because riding was so erratic in 2020 of course I rode most days for sanity, with no clear pattern as to which days of the week I preferred.2021 was a different story! I secured employment in January and even though I work from home, daily rides were still necessary, and I got out most days after work. The 2021 chart reflects those post work "commutes".
Higher mileage on weekends is also a sign of normalcy. I relish the sun and stay outside as long as possible, especially this autumn. With a less than stimulating job and busy early mornings, I live for night rides and enjoy weekend daylight - the chart proves it!
 |
| 2020 |
 |
| 2021 through the end of October. |
With 3142 total miles in 2020, I'm on track to meet, if not surpass, last years mileage.
 I learned to ride on snow covered paths during winter 2020/2021, a big change from low mileage January- February 2020. Rocking studded tires means I ride most winter days.

Interesting set of stats Annie, I just go by what I have recorded on Strava. At the moment I am unable to cycle and I miss it so much as I have been cycling regularly for 65 years and to not to be able to ride now is hard.
ReplyDeleteEnjoyed seeing this laid out in graph form. Kudos to you for keeping stats which is something I just can't get myself to do even though I do think it would be interesting. Thanks for sharing.
ReplyDelete